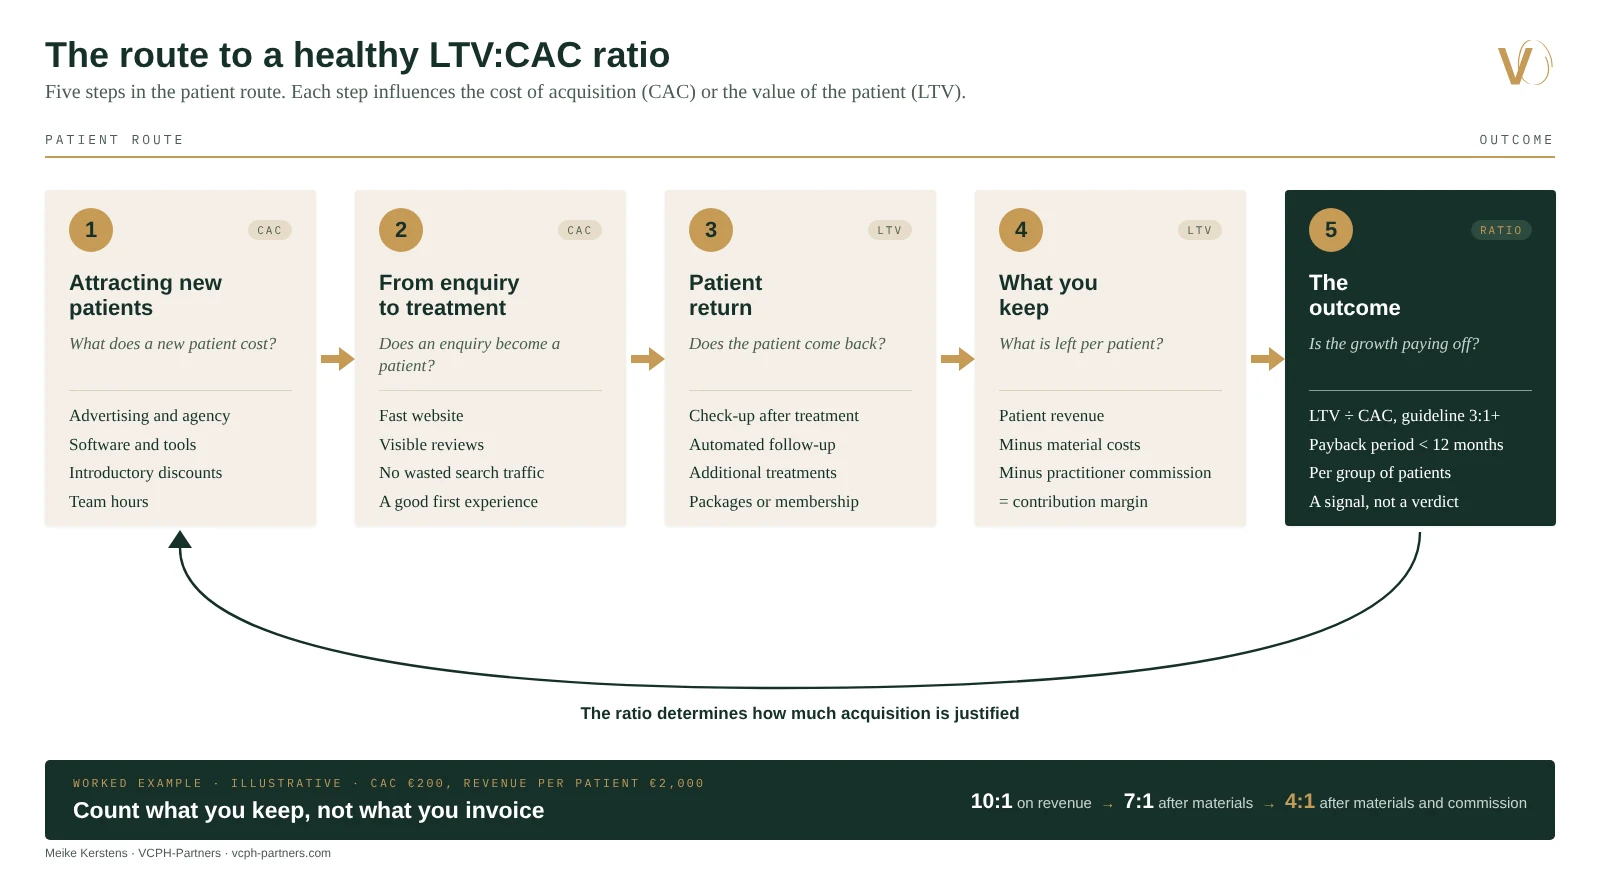
What does a new patient cost, and what is their true value?
The LTV:CAC ratio answers that question in a single metric. This article explains in plain language what the ratio means, what you can and cannot conclude from it, and where to start optimising.
Meike Kerstens · 22 October 2026 · Reading time ± 8 minutes
Every clinic grows by acquiring new patients and retaining existing ones. Both require an investment of time and capital. The fundamental question is: does that investment yield a sustainable return?
Most owners track revenue and the monthly number of new patients. That is a starting point, but it does not reveal whether that growth is actually profitable. That is where the LTV:CAC ratio comes in. You do not need to be a financial specialist; you only need to answer two core questions.
CAC · Customer acquisition cost
What it costs
The total expenditure required to acquire one new patient: advertising spend, agency fees, software, introductory discounts, and the time your team spends on it.
LTV · Lifetime value
What you actually retain
The net value a patient generates over the entire relationship with your clinic, calculated on what you retain (margin), not on what you invoice (revenue).
If your calculated ratio is 3:1, a patient generates on average three euros in contribution margin for every euro spent to acquire them. That is the core principle. The rest of this article focuses on how to calculate this number honestly and interpret it sensibly.
Worked example: one clinic, three radically different outcomes
The most common misconception lies in the word value. Calculated on revenue, performance appears exceptional. Calculated on what remains after the direct costs, the picture changes dramatically.
Consider a clinic that spends €200 to acquire a new patient, where that patient generates an average of €2,000 in revenue.
ON GROSS REVENUE
10:1
€2,000 ÷ €200
Looks exceptional, but is the most optimistic and misleading calculation.
AFTER MATERIAL COSTS
7:1
€1,400 ÷ €200
After deducting 30% for materials, consumables and product purchasing.
After material costs and practitioner remuneration
4:1
€800 ÷ €200
After deducting 30% material costs and a 30% practitioner fee, 40% remains. This is the realistic operational outcome.
Methodological noteThese percentages are an illustrative worked example. In practice, material purchasing and practitioner remuneration vary per clinic and per treatment. If your doctors are salaried or you are the treating owner, the structure differs, but the core principle remains the same: only count what you actually keep.
How to interpret the result
In practice, 3:1 is widely seen as the baseline for healthy unit economics, provided the payback period on acquisition costs is under 12 months. Treat this as a strategic guideline, not an absolute law. The breakdown below is a practical reading guide.
1:1 or lower
Every new patient costs more than they generate in margin. Immediately audit your advertising expenditure and the contribution margin per treatment.
1:1 to 3:1
You cover the direct acquisition costs, but leave virtually no margin for overheads or scaling. A single operational setback endangers profitability.
3:1 to 5:1
The optimal zone, where reinvesting in growth is structurally justified.
Above 5:1
A strong financial result, but it raises two strategic questions: are you underinvesting in marketing and leaving growth on the table? Or has your LTV been calculated too optimistically?
What the ratio does not reveal: cash flow and history
The ratio compares a future estimate against a past cost item. It does not reveal when the money comes back. Two clinics with an identical ratio can carry very different liquidity risks: one recovers its acquisition cost after four months, the other after two years. So also look at the payback period, preferably per group of patients who started in the same period.
Furthermore, LTV relies on historical patterns and is always an estimate of the future. For a young clinic or a new treatment offering with little history, treat the ratio as a signal to look further, not as a final verdict.
Five clinic business models, five distinct patterns
Every clinic has its own commercial logic. Below are five illustrative models showing how acquisition costs and returns can interact.
These are not existing clinics and the descriptions are not measured data. They illustrate how the pattern between costs and returns can differ per model.
AssumptionThe models come from my own analysis and are deliberately shown without figures: they describe patterns, not measured values.
Model 1
The Luxury Artisan
Full-face treatment plans and premium combinations for patients who consciously choose top-tier expertise and are willing to invest in comprehensive care.
Strength
Exceptionally high value per patient and a highly loyal client base.
Patients often travel specifically for this expertise.
Key consideration
Highly dependent on the personal reputation of the lead practitioner.
Model 2
The Established Authority
Established clinic organisations where medical authority, recognised protocols and brand trust drive patient volume.
Strength
A high proportion of organic inflow, stable retention and strong resilience against price competition.
Medical aesthetics combined with accessible beauty services and professional skincare within a single integrated patient database.
Strength
Low acquisition costs because high-frequency care and retail act as a natural, low-threshold entry to medical treatments.
Key consideration
Higher operational complexity; risk of diluting medical authority if the balance between wellness and medical is not clearly guarded.
Model 4
The Volume Specialist
A focused portfolio of high-demand treatments with fast turnaround times, competitive pricing and broad geographic coverage.
Strength
Strong economies of scale and purchasing power.
Broad geographic presence lowers the barrier for patients (there is always a location nearby) and increases the return on national marketing campaigns.
Key consideration
Patients switch more easily to a cheaper or closer alternative; retention and loyalty are lower.
Marketing pressure must stay consistently high to keep all locations filled.
The margin per treatment slot is narrow, so strict control of utilisation and operating costs is essential.
Model 5
The Boutique Clinic
Personal, local care where new patient growth is driven primarily by word-of-mouth recommendations.
Strength
Almost no direct acquisition spend and a close bond with the patient.
Key consideration
Growth is limited by the owner’s schedule; difficult to hand over or exit if the value sits in one person.
AssumptionEven a clinic that grows almost for free through recommendations has costs. The hours the owner or the team spends on relationship building are rarely included in the CAC. If you count them, the ratio is lower than it looks at first sight.
Key levers: optimising LTV and CAC
Improving the ratio means adjusting two parameters: raising the value per patient or lowering the cost of acquiring them. In practice, start with the LTV.
Increasing patient lifetime value (LTV)
Track cohort retention. Measure the percentage of patients who return within 12 months of their first treatment.
Structured follow-up. Automated reminders for check-ups and maintenance appointments at the right moment.
Comprehensive care pathways. Guide patients from an entry treatment to a suitable multi-stage treatment plan.
Consider packages or memberships, but see the FAQ below: they only work with a robust structure.
Reducing customer acquisition cost (CAC)
Allocate the full cost. Include agency fees, software and staff hours, and see where budget leaks away.
Optimise conversion. A fast website, visible reviews and a good first experience.
Use negative targeting. Exclude irrelevant traffic and non-converting search queries in your paid campaigns.
Diversify your channels so you do not depend on a single platform or agency.
One example from practice: an American doctor wrote in 2019, in an article of the American Med Spa Association, that patients with a membership came on average 2.9 times a year, against 1.44 visits on average in the practice, and spent 35% more. That is a statement by one doctor, in the United States, from 2019. See it as an indication and not as a norm for the Benelux.
Five practical steps to get started
Establish your true baseline. Calculate LTV on the contribution margin and CAC including all hidden operational and staff costs.
Track timing and cohorts. Besides the ratio, monitor the payback period, per group of patients who started in the same period.
Plug the retention leaks. Plan a check-up after the first treatment and ensure structured follow-up.
Build recurring revenue. Test packages or memberships with real commitment and track cancellations in the first six months.
Optimise your acquisition channels. Invest in findability, reviews and a strong first impression, while spreading channel risk.
Frequently asked questions
What is a good LTV:CAC ratio?
In the sector, 3:1 or higher is often seen as healthy, with a payback period of less than 12 months. These are guidelines from sector and marketing sources, not a legal norm. What is good for your clinic depends on your model, your capital and your growth ambition.
My ratio is much higher than 5:1. Is that good news?
Sometimes, but first check two things. Is the LTV calculated on revenue instead of margin? Then the ratio looks higher than it is. And have all acquisition costs been counted? If the calculation is right, a very high ratio can mean you invest less in growth than you could. That can be a deliberate choice, for example if the owner’s schedule is already full.
What do I include in the CAC?
Everything it costs to bring in a new patient: advertising budget, agency costs, software, introductory discounts and the time of staff who work on acquisition and intake. Many clinics forget the last two, so the CAC comes out too low.
Do we calculate with revenue or with profit?
With what you keep after the direct costs, the contribution margin: revenue minus purchasing of materials minus the practitioner’s remuneration. Calculating on revenue gives too rosy a picture, as the worked example above shows.
My clinic is still young. How do I determine the LTV then?
Then you have little history yet, and an LTV over three years is an estimate. In that case, use the payback period as the main steering number and look per group of patients at how many come back after three, six and twelve months. As soon as there is more data, you can adjust the LTV.
What is the payback period?
The time it takes before the margin of a new patient has covered the cost of acquiring them. A guideline from the sector is less than 12 months. The number complements the ratio, because the ratio itself says nothing about timing.
Should I introduce a membership or packages?
Not automatically. Membership can increase patient return, but it is no guarantee. A marketing agency from the sector cites a cancellation rate of about 40% in the first six months for the average membership, against less than 8% for the best-performing programmes. According to that source, the difference lay in the structure (for example credit that expires on cancellation), not in the discount. That is an agency source and not research, so see it as an indication. Test small and measure the first six months.
How often should I measure this?
Quarterly is enough for most clinics. Also look in between when your marketing or offering changes. A one-off calculation says little; the trend says more.
I grow mainly through recommendations. Is this still relevant?
Yes, even if the CAC looks low. It shows what a patient brings in and how often they come back. And it helps with the question of how much growth the clinic can handle without everything depending on the owner’s schedule, certainly if you want to hand over or sell in a few years.
Sources and accountability
Thresholds of 3:1 and payback under 12 months: sector guidelines, including Launch Advisor, "Unit Economics for Private Healthcare & MedSpa Practices" (2026) and Patientfy, "The 3:1 Rule: The LTV:CAC Ratio for a Healthy Med Spa" (2026).
Membership and visit frequency: American Med Spa Association, "The Pros & Cons of Membership Programs for Medical Spas" (2019), statement by Dr. A. Jay Burns.
Membership cancellation: Aesthetic Patient Acquisition, "Top 10 Med Spa Membership Program Ideas" (2026). Agency source, treat as an indication.
Timing and estimation risk of the ratio: Isoglu (2026) and Tunguz (2017). These sources come largely from SaaS and marketing, not from the aesthetic sector.
The amounts in the worked example and the five clinic models are illustrative estimates from my own analysis. They are not published or measured figures from existing clinics.
BUSINESS & PERFORMANCE HEALTH SCAN
From a single metric to the full picture
The LTV:CAC ratio is one of the patient KPIs in the Business & Performance Health Scan. Not to give you a figure, but to see where your growth comes from, where patients drop out and which choices make the difference. Besides patient data, we look at business performance, management and culture.