BUSINESS & PERFORMANCE HEALTH SCAN · CLINIC KPIs
The Aesthetic Clinic as an Ecosystem
Why isolated KPIs get in the way of steering. This article shows what each part of the Health Scan means, how the parts influence each other and what the advantages and points to watch are of the decisions you base on it.
In this article
- Revenue and profit tell you what happened, not “why”!
- Five parts, two directions
- Part 1: marketing and conversion
- Part 2: capacity and utilisation
- Part 3: the service mix
- Part 4: retention and patient value
- Part 5: what is left at the end (financial health)
- What the report does not show: the team
- Five questions before you make a decision
- Frequently asked questions
- Sources and accountability
Revenue and profit tell you what happened, not “why”!
Anyone who wants to change the outcome with an eye to the future looks a layer deeper, at the connections.
Five parts, two directions
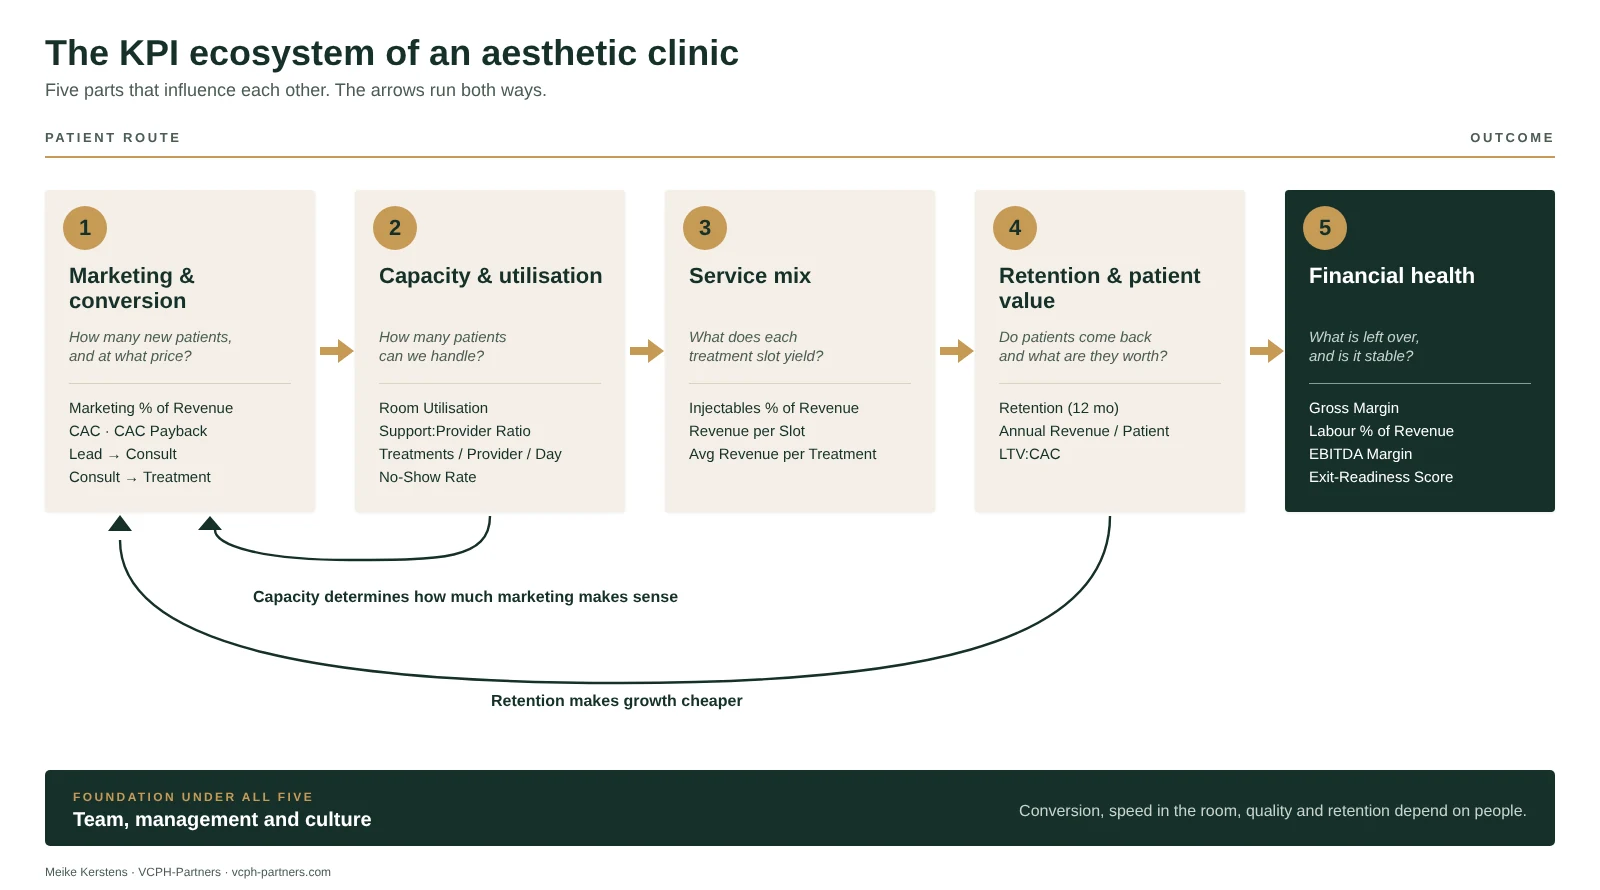
Indicators following the patient journey
There are many KPIs. But they only become useful when you see them in relation to each other.
We create overview by following the logical route of the patient. See this order as the steps in that journey, not as a ranking of importance.
- 1Marketing & conversionMarketing % of Revenue, CAC, Lead → Consult, Consult → Treatment, CAC Payback
- 2Capacity & utilisationRoom Utilisation, Support:Provider Ratio, Treatments / Provider / Day, No-Show Rate
- 3Service mixInjectables % of Revenue, Revenue per Slot, Avg Revenue per Treatment
- 4Retention & patient valueRetention (12 mo), Annual Revenue / Patient, LTV:CAC
- 5Financial healthGross Margin, Labour % of Revenue, EBITDA Margin, Exit-Readiness
The feedback in the chain
Two crucial connections run against the direction of the patient journey:
- Capacity determines marketing
- How many patients the schedule and team can handle determines how much acquisition makes sense.
- Retention lowers costs
- Returning patients require no new acquisition costs, which makes growth cheaper.
How firm the connections are
Not every connection is equally firm. To make this transparent, each connection in this article gets one of these three labels:
- Arithmetical
- Follows from the definition and is always true (for example: the same advertising costs divided by more patients = lower CAC).
- Behavioural
- A mechanism that often occurs but depends on the clinic. You need to see this in your own data.
- Hypothesis
- An assumption you must first test before spending money on it.
The trade-offs for each decision are general; how heavily they weigh differs per clinic.
Part 1: marketing and conversion
Why this matters
The start of the patient journey
You spend part of your revenue on marketing. This generates enquiries.
Whether and how quickly these enquiries become patients is determined by your team and the process: how customer-friendly and efficient the follow-up is and how the consultation goes.
We measure two things:
- What does a new patient cost? (blended CAC)
- How did this CAC come about? (conversion from lead to consultation and from consultation to treatment)
What moves what
- Conversion up
- The CAC falls with the same budget, because the same costs are divided by more new patients. This also shortens the payback period (CAC Payback).
- Two conversion steps
- The total conversion (Lead → Treatment) is the product of Lead → Consult and Consult → Treatment.
- More marketing
- Generates more enquiries, but only more patients if conversion and your capacity grow along. Otherwise mainly the CAC rises.
- Breaking down the blended CAC
- One average across all channels can hide a good channel and an expensive channel. Test whether you can measure per channel before you shift budget.
Decisions and their price
DecisionIncrease the marketing budgetThe fastest way to get more enquiries.
Advantages
- More enquiries and faster growth.
- Quick insight into which channels and messages work.
- Makes optimal use of free capacity (provided conversion is in order).
Points to watch
- The CAC can rise if a channel becomes saturated.
- Extra enquiries without free capacity or follow-up lead to losses.
- The spending comes before the revenue: this requires sufficient cash flow.
Relevant KPIs: CAC per channel, Lead → Consult, Room Utilisation, CAC Payback
DecisionInvest in the team’s conversionTraining, a fixed follow-up process and a faster response time to enquiries.
Advantages
- More return from the same advertising budget (lower CAC).
- The effect carries through positively on every marketing channel.
- A strong first experience promotes patient retention (behavioural).
Points to watch
- Takes the team’s time; the result is only visible after a few weeks.
- Dependent on staff: turnover can make the built-up knowledge disappear again.
- Requires that you have insight into the conversion per step (and preferably per employee).
Relevant KPIs: Lead → Consult, Consult → Treatment, CAC, CAC Payback
DecisionUse multiple acquisition channels at the same timeSpreading acquisition across multiple platforms and agencies.
Advantages
- Less dependent on one platform (or sudden rule and algorithm changes).
- Direct insight into performance per channel, so you can more easily shift budget to what works.
Points to watch
- Requires more management, coordination and accurate measurement per channel.
- With a fragmented budget you build volume and data to learn from more slowly per channel.
Relevant KPIs: CAC per channel, Lead → Treatment per channel
Part 2: capacity and utilisation
Why this matters
This part is often the invisible limit to growth. An empty treatment room earns nothing, but an overfull room without the right support doesn’t either.
If a practitioner spends too much time on tasks a colleague can take over, valuable time and treatment space are lost. The ratio between support and practitioner (Support:Provider Ratio) determines how many treatments a doctor can perform per day.
The right ratio differs per clinic, but the principle is simple: with the right support, a doctor can go straight on to the next patient. The number of treatments per day rises, and with it the revenue per practitioner.
What moves what
- More support per doctor
- The doctor can focus fully on treating. The number of treatments per day (Treatments / Provider / Day) rises, which increases the revenue per practitioner.
- A packed schedule
- Can cause new enquiries to wait too long for an appointment. As a result, potential patients drop out, which pushes down conversion. Test in your own data whether this plays out in your clinic.
- No-shows up
- Booked slots stay empty. Utilisation (Room Utilisation) falls immediately and the lost revenue (Lost Revenue No-Shows) rises.
- Consequence for your financial result
- With practitioners on salary, the fixed payroll costs simply keep running, so the lost revenue comes entirely at the expense of your margin. If you work with a percentage per treatment, you lose the margin on the appointment that was not carried out (depending on what is in your contracts).
Decisions and their price
DecisionIntroduce a no-show policyFor example reminders, a confirmation or a deposit.
Advantages
- Fewer empty slots and less lost revenue.
- Patients feel committed to the appointment.
- Selection of patients who are serious.
- Reminders are cheap and easy to automate.
Points to watch
- A deposit can be a threshold for new patients (hypothesis: test it).
- Extra administration and clear communication needed.
- Strict rules can damage the relationship with the patient.
Relevant KPIs: No-Show Rate, Room Utilisation, Lead → Consult (to recognise a threshold)
DecisionExtra rooms or longer opening hoursMore capacity when the schedule is structurally full.
Advantages
- Room for more patients and less waiting time.
- Room for expansion into new specialisations.
- Basis for scaling up.
Points to watch
- High fixed costs before the extra revenue is there.
- Risk of vacancy if the inflow does not grow along.
- It is often cheaper to first make better use of what you already have.
Relevant KPIs: Room Utilisation (also at peak hours), Revenue per Room / mo, CAC Payback
Part 3: the service mix
Why this matters
A balanced service mix offers your patients a broad range of treatments, so they can come to your clinic for multiple needs. It is essential that the service mix closely matches the needs of your (desired) target group and what your team and capacity can actually handle.
In addition, every treatment brings in different income. Two key figures make this clear:
- The revenue per slot (Revenue per Slot)
- The average revenue per treatment (Avg Revenue per Treatment)
What moves what
- Revenue per slot vs. margin per slot
- These are two different figures. Margin per slot is the revenue minus the direct costs (such as material and purchasing costs). The ranking of the most valuable treatments can turn out very differently on margin than on revenue.
- Shift in the service mix
- With constant utilisation, your total revenue and your result can still rise or fall, purely depending on which treatments get more room in the schedule.
- Price adjustment
- With a price increase the margin per slot rises immediately. Demand may (slightly) fall or shift to cheaper treatments. If the drop-out stays limited, the return per hour rises considerably.
With a price decrease you often attract a different type of patient and the margin per slot falls immediately. The extra volume of treatments you bring in must fully compensate this loss of margin to make a profit at the bottom line. - Treatments with a fixed rhythm
- Treatments that have to be repeated periodically support patient retention because patients come back for maintenance by themselves (behavioural: test this per treatment in your own data).
Decisions and their price
DecisionAllocate more slots to treatments with the highest margin per slotSteering on the net return per treatment slot instead of on gross revenue.
Advantages
- Higher financial result from the same treatment rooms and the same team.
- Increases the efficiency of the current capacity without the need for expansion.
Points to watch
- Greater dependence on a smaller number of popular or high-margin treatments.
- Total gross revenue may fall while net profit rises: this requires the right steering and explanation within the team.
- Requires accurate insight into the direct costs per treatment (including purchasing, depreciation and preparation time).
Relevant KPIs: Revenue per Slot, Margin per slot, Injectables % of Revenue, Avg Revenue per Treatment
DecisionAdjust prices (lower for volume or raise for margin)Sharper prices to chase utilisation, or raise prices to maximise the return per slot.
Advantages
- With a price decrease: can achieve a quick rise in inflow and schedule utilisation (useful with free capacity).
- With a price increase: directly raises the margin per slot and the return per hour worked without extra workload.
Points to watch
- With a price decrease: the margin per slot and the EBITDA margin come under pressure; the volume must fully absorb the decline. In addition, the patient profile changes and a later price increase is difficult.
- With a price increase: risk of a slight drop in patient volume growth or a shift to cheaper alternatives (behavioural: test this per treatment).
Relevant KPIs: Avg Revenue per Treatment, Margin per slot, Retention (12 mo), EBITDA Margin
DecisionMaintain a broad treatment offeringOffering multiple types of treatment and disciplines under one roof.
Advantages
- Risk spreading and more cross-sell reasons for existing patients to return.
- Flexibility to quickly adjust the service mix when market demand or purchasing costs change.
Points to watch
- Higher operational complexity: more training, a broader choice of equipment and stock.
- Less sharp positioning as a specialist in one specific field.
Relevant KPIs: Revenue per Slot per treatment type, Annual Revenue / Patient
Part 4: retention and patient value
Why this matters
Acquiring a new patient costs money. Whether and when you earn back those acquisition costs depends on the total patient experience: the first consultation, the treatment result, the service, the aftercare and the follow-up for further appointments.
This is where retention becomes decisive:
- Retention (12 mo) is the approximation (proxy) of the share of patients who return within a year.
- Annual Revenue / Patient measures what an active patient spends with you on an annual basis.
Together these figures determine the total value of a patient for your clinic, and with it the ratio to the acquisition costs: the LTV:CAC ratio (Lifetime Value relative to Customer Acquisition Cost). Read more about it in the article on LTV:CAC.
What moves what
- LTV:CAC ratio
- This is the total value of a patient divided by the cost of acquiring them. A higher patient value (LTV) or a lower acquisition price (CAC) improves this ratio by definition (arithmetical).
- Retention up
- Patients return more often and the annual spend per patient rises. This reduces your direct dependence on a continuous new inflow and therefore on a high marketing budget.
- The bridge between part 1 and part 4
- LTV:CAC connects the start and the follow-up phase of the patient journey: the CAC comes from marketing and conversion (part 1), while the LTV is built up by retention and the service mix (parts 3 and 4).
- Patient experience and team performance
- The quality of the treatment, the level of service and the continuity of your team influence repeat visits (behavioural / hypothesis: test in your own data how strong this relationship is in your clinic).
Decisions and their price
DecisionIntroduce memberships or treatment packagesA fixed repeat rhythm and (advance) payment in exchange for commitment.
Advantages
- More predictable return and more stable revenue streams.
- Increases retention because patients commit to the clinic for longer.
- Offers a firmer basis for efficiently planning your utilisation.
Points to watch
- Risk of cancellations if the substantive added value is missing (a mere price discount does not build real commitment).
- The average margin per single visit may fall.
- Brings continuous administrative and operational obligations, even with scarce capacity.
Relevant KPIs: Retention (12 mo), Annual Revenue / Patient, Churn / Cancellations, Room Utilisation
DecisionOrganise automated and structured follow-upSetting up check-up appointments and follow-up reminders at the right moment.
Advantages
- Prevents active patients from quietly slipping out of sight.
- Increases patient satisfaction through proactive aftercare and personal attention.
- Winning business from the existing patient pool is considerably cheaper than new inflow (lower dependence on CAC).
Points to watch
- Requires a well-set-up EHR/CRM system in which patient data and contact history are accurate.
- Too frequent or generic reminders can be experienced as pushy or commercial.
- Requires continuous discipline from the team to carry out follow-up tasks and protocols strictly.
Relevant KPIs: Retention (12 mo) per practitioner, Revenue per Provider/mo
DecisionLink patients to a fixed practitionerDeliberately building a personal bond of trust as the basis for long-term retention.
Advantages
- High patient loyalty: a trusted practitioner considerably lowers the threshold for repeat treatments (behavioural).
- Better treatment continuity and higher satisfaction through personal knowledge of the file.
Points to watch
- Makes continuity and retention vulnerable in case of illness, absence or departure of the practitioner concerned.
- Can limit flexibility in scheduling if patients refuse appointments with other practitioners.
Relevant KPIs: Retention (12 mo), Retention per Practitioner, Annual Revenue / Ticket price
Part 5: what is left at the end (financial health)
Why this matters
The last part is the sum of the four earlier steps. Here we steer on key figures such as:
- Gross Margin (gross margin)
- Labour % of Revenue (share of payroll costs)
- Revenue per Labour Euro (revenue per payroll euro)
- YoY Revenue Growth (revenue growth compared with last year)
- EBITDA Margin (operating profitability)
What moves what
- Payroll costs up
- With constant revenue the EBITDA margin falls immediately (arithmetical).
- The real cause behind high payroll cost pressure
- A payroll share that is too high usually does not stem from salaries that are too high, but from: (1) revenue per practitioner that is too low (part 2: capacity & utilisation), (2) a service mix with too little margin per slot (part 3: service mix) or (3) conversion or patient inflow that is too low (part 1: marketing & conversion). So look for the solution primarily in those earlier phases.
- How buyers and investors look
- A stable margin, predictable retention and healthy growth give a buyer confidence that the results are sustainable (behavioural). What weight is given to individual KPIs differs per party.
- One-off vs. structural results
- Valuations are often based on a multiple of the EBITDA. A rise or fall therefore counts many times more heavily if it is structural in nature. You must be able to clearly substantiate the difference between one-off windfalls and structural returns.
Decisions and their price
DecisionReduce payroll costsFewer staff or adjusting staffing levels and remuneration.
Advantages
- Direct effect on the cost structure and the EBITDA margin (arithmetical).
- Sometimes necessary if the available capacity is structurally not used.
Points to watch
- Affects the direct treatment capacity, the level of service and the atmosphere within the team.
- Risk of a fall in conversion and retention due to lower patient satisfaction (behavioural).
- Staff turnover brings extra recruitment, selection and onboarding costs.
Relevant KPIs: Labour % of Revenue, Revenue per Labour Euro, Treatments / Provider / Day, Lead → Consult, Retention (12 mo)
DecisionChoose growth over marginInvesting in a larger market share and faster revenue growth, accepting that the profit margin is lower in the short term.
Advantages
- Builds scale, brand awareness and a stronger negotiating position with suppliers (lower purchasing costs over time).
- An excellent strategy for a clinic with expansion ambitions or one that wants to become attractive for acquisition or joining a chain.
Points to watch
- The EBITDA margin can fall considerably for a while and the internal organisation and processes come under pressure.
- Revenue growth without a healthy margin is hard to explain to investors and banks in the longer term.
- Requires sufficient working capital or financing and tight management discipline so that costs do not get out of hand.
Relevant KPIs: YoY Revenue Growth, EBITDA Margin, CAC Payback, Room Utilisation
DecisionChoose margin over growthFirst getting operating profitability and processes in order before expanding further.
Advantages
- More stable profit development and a considerably stronger and more predictable story in a possible sale of the clinic.
- Builds a healthy cash flow, which gives more financial room for future investments.
Points to watch
- Revenue growth flattens out, so competitors who scale aggressively can win market share.
- Deliberately slowing down expansion can demotivate the team or ambitious employees.
Relevant KPIs: EBITDA Margin, Gross Margin, YoY Revenue Growth, Exit-Readiness Score
Note: sale readiness and PE readiness
A sale-readiness score (such as an Exit-Readiness Score or PE Checklist Readiness) summarises how far your clinic meets the requirements that buyers and Private Equity parties set. It is a practical tool for preparing strategic conversations, expressly not a business valuation.
NoteAlthough tax structure and legal compliance are essential parts of a sale process, they fall outside the operational focus of this KPI guide.
What the report does not show: the team
Each part above depends on people. The front desk determines the conversion, the assistant the pace in the room, the doctor the value of the advice conversation and the whole team the chance that a patient comes back.
AssumptionA clinic with a lot of turnover, unclear agreements and an owner who decides everything themselves often sees that reflected in varying conversion, varying quality and falling retention. You see it in the numbers, but the cause is not in the numbers. That is why, in the Business & Performance Health Scan, I look at management and culture as well as business figures.
Five questions before you make a decision
Use this check for every decision from this article, big or small.
- 1Which number exactly do I want to improve, and why?Without a concrete, measurable goal you cannot assess the eventual effect of your decision.
- 2Which other numbers move along automatically?Identify at least two other parts of the chain that are affected directly or indirectly by this intervention.
- 3How certain is that connection?Is the causal relationship arithmetical, behavioural or a hypothesis? Always test a hypothesis on a small scale first before committing significant budget.
- 4Does the rest of the chain have room for this?Check your capacity in particular: can your team, treatment rooms and operational processes actually handle the extra inflow or follow-up demand?
- 5How do I measure whether it works, and when do I adjust or stop?Define in advance which KPI you monitor and after how many months you evaluate the outcome, to push on or reconsider the decision.
Frequently asked questions
Do I have to measure all these KPIs?
What is a good norm or target value for each KPI?
My revenue is growing, but my margin is not. Where do I start looking?
Is this method also relevant for a smaller clinic?
Is a dashboard the same as steering with this ecosystem?
Does this framework help if I want to sell my clinic in a few years?
My data is not in order at the moment. Can I still start?
Sources and accountability
- Data use: this article contains no figures from existing clinics and makes no use of external research data or market benchmarks.
- Causality and assumptions: all connections are explicitly classified as arithmetical (follows directly from definitions), behavioural (mechanism dependent on the clinic context) or hypothesis. The advantages and points to watch mentioned concern general operational trade-offs; the exact impact differs per clinic.
- Naming: the KPI names used follow the reporting structure of the Business & Performance Health Scan.
- Scope: this article is written as an operational and strategic steering framework and expressly does not constitute tax, legal, financial or compliance advice.
BUSINESS & PERFORMANCE HEALTH SCAN
From separate figures to one coherent picture
In the Business & Performance Health Scan we place the connections from this article next to the figures of your own clinic. We look at business performance, at management and culture, and we discuss what that means for your next step: growing, professionalising or preparing for a handover.
On this theme
Read also
Acquisition Costs vs. Lifetime Value: Understanding Patient ROI
The LTV:CAC ratio explained using a practical worked example, five distinct clinic business models, and answers to frequently asked questions.
Read article →
Growth Isn’t the Problem—Uncontrolled Growth Is
Three critical growing pains in an expanding aesthetic clinic and the operational steps to take before performance stalls.
Read article →